

What Does Roast Profile Mean? A Home Roaster's Guide
A roast profile is the time-temperature path that coffee beans follow from the moment they enter the drum to the moment they drop into the cooling tray. Every second of that journey is recorded as a curve, and that curve determines whether your cup tastes bright and fruity, balanced and sweet, or deep and bitter. Change the curve, and you change the coffee.
Two numbers sit at the center of every profile: Bean Temperature (BT), the actual temperature of the bean mass measured by a thermocouple probe, and Rate of Rise (RoR), the speed at which that temperature climbs per minute. A healthy roast profile shows a smoothly declining RoR, typically dropping from 10–12°C/min at the turning point to 4–6°C/min at drop, following a stable declining trend. Together, BT and RoR tell the full story of what is happening inside the drum.
The profile also defines roast level. Light roasts drop early, preserving acidity and floral notes. Medium roasts balance sweetness and body. Dark roasts push further into caramelization and bitterness. Each outcome is a direct product of the curve you build.
- Bean Temperature (BT): the core measurement; drives all roast decisions
- Rate of Rise (RoR): the momentum behind BT; a smooth decline signals even development
- Roast levels: light, medium, and dark are outcomes of where and when you drop the beans
- Consistency: a saved profile lets you reproduce the same cup batch after batch
Common roasting terminology and what each term actually means
Reading a roast curve is far easier once you know the landmarks. These are the terms you will encounter on every profile chart.
- Charge temperature: the drum temperature at the moment green beans are loaded, typically ranges within a common high heat range suitable for roasting. It sets the initial energy available to the beans.
- Turning point: the lowest BT the beans reach before they start climbing, usually falls within a range that represents the shift from drying to active heating. This marks the shift from endothermic drying to active heat absorption.
- Environmental Temperature (ET): the air or drum temperature surrounding the beans, not the beans themselves. ET typically runs noticeably above BT to reflect air and drum temperatures higher than bean temperature and responds faster to heat adjustments.
- Maillard reaction: browning reactions that begin around 150°C, where amino acids and sugars combine to create hundreds of flavor compounds.
- First crack: the audible structural fracture of the bean, occurring around temperatures around the typical first crack range.. This marks the start of the development phase.
- Development time: the time elapsed between first crack and drop. Longer development generally increases body and reduces acidity.
- Development Time Ratio (DTR): development time as a percentage of total roast time. Per Scott Rao, DTR is a quality control tool, not a fixed target, and its ideal value depends entirely on roast style and equipment.
- Drop temperature: the final BT when beans are ejected, ranging a range consistent with typical roast finishing temperatures, varying by desired roast level.
| Landmark | Typical BT | What it signals |
|---|---|---|
| Charge temp | within a typical drum temperature range used at bean loading. | Starting energy before beans load |
| Turning point | within a typical temperature range for the lowest bean temperature before rise. | Beans begin absorbing heat |
| Maillard onset | around the temperature where browning reactions begin. | Browning and flavor compound formation begins |
| First crack start | temperatures around the typical first crack range. | Development phase opens |
| Drop | within a common temperature range for ending the roast. | Roast level locked in |
For a deeper look at how roast levels translate to flavor, Font-mag’s roast levels flavor guide covers the full spectrum from cinnamon roast to French roast with practical tasting notes.
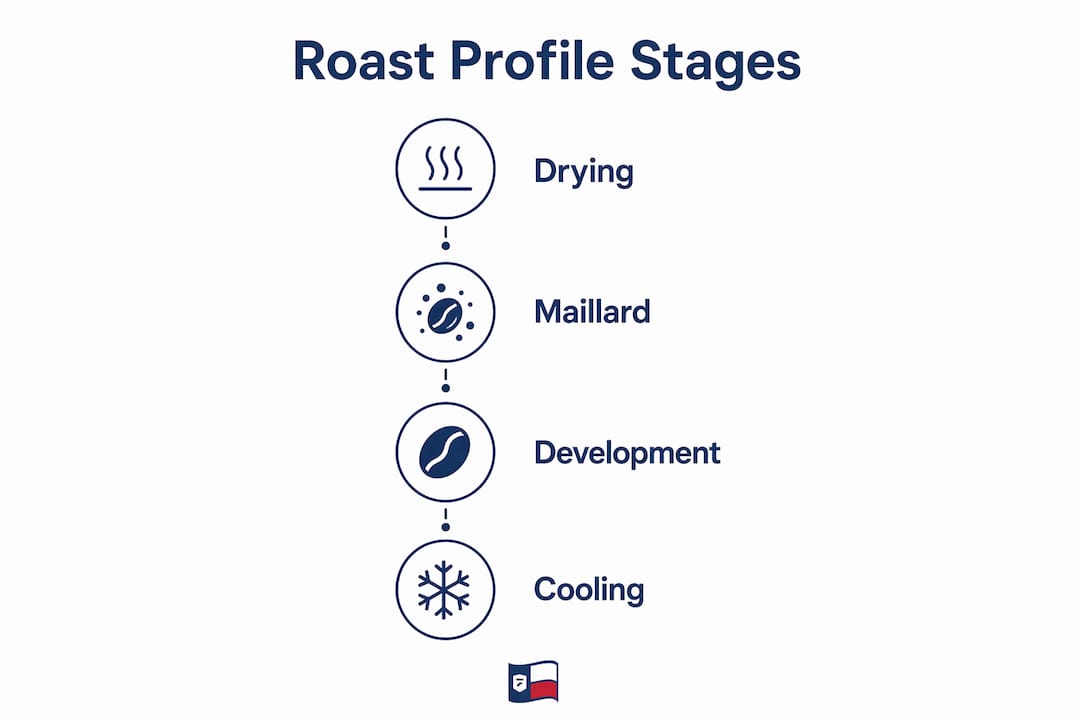
How each stage of roasting shapes the flavor in your cup
Roasting moves through three distinct phases, and each one leaves a fingerprint on the final cup.
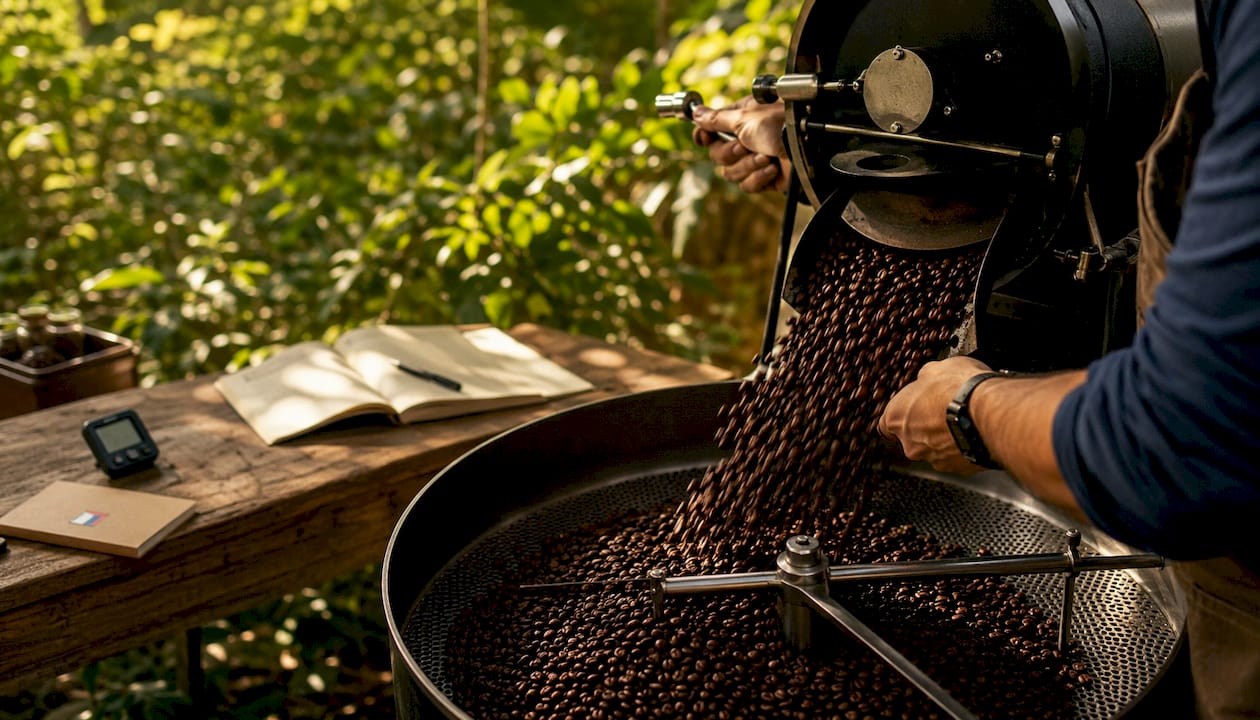
The drying phase runs from charge through the turning point and up toward yellowing. Green beans carry significant moisture, and the roaster’s first job is driving that moisture out. This phase is largely endothermic: the beans absorb heat without rising much in temperature. A prolonged drying phase tends to mute acidity and can produce a flatter cup if pushed too far.
The Maillard browning phase begins around 150°C and runs to first crack. This is where the real flavor architecture gets built. Amino acids and reducing sugars react to produce caramel-like sweetness, nutty notes, and the brown color associated with roasted coffee. Faster heat application through this phase pushes sweetness and caramelization; slower application can result in a more complex, layered cup.
The development phase starts at first crack and ends at drop. This is the shortest phase and the most consequential. A short, aggressive development time preserves bright, fruity notes. Extend it, and you trade acidity for body and depth. Push it too far, and bitterness takes over. The roaster’s judgment in these final minutes defines the character of the coffee more than any other single decision.
What actually affects how a roast profile develops
No two coffees respond to the same profile identically. Bean characteristics drive that variability, and understanding them is what separates a thoughtful roaster from someone just following a template.
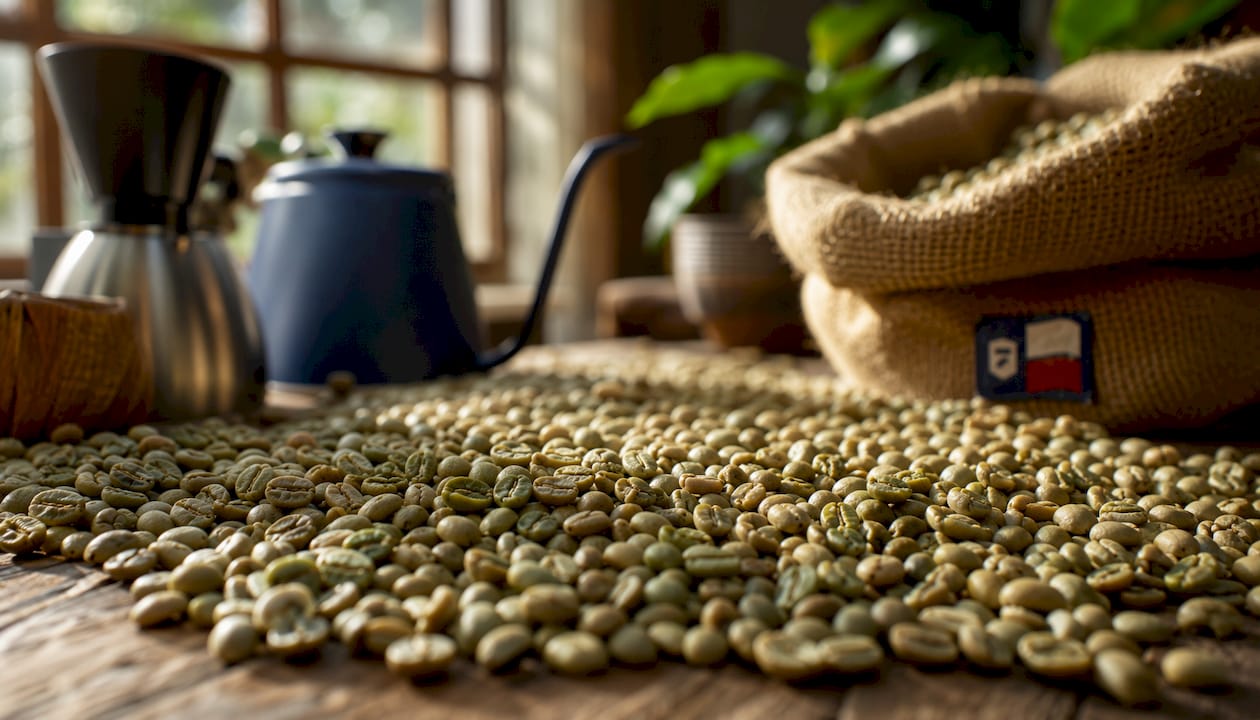
Bean density is the biggest variable. High-density beans, typically grown at elevation, require more initial heat because their compact cellular structure resists heat transfer. Low-density beans absorb heat faster and can scorch if the charge temperature is too aggressive. Bean density and processing directly influence how heat moves through the bean mass and how the roast timing unfolds.
Moisture content affects the drying phase length. Freshly harvested or high-moisture beans need more time and energy to dry before browning can begin. Beans that have been stored longer arrive drier and move through the early phase faster.
Screen size (bean size) matters because larger beans have more surface area but also more mass. Uneven sizing within a batch creates uneven roasting, which is why specialty roasters often sort by screen size before profiling.
Processing method changes the sugar content of the bean. Natural-processed coffees retain more residual fruit sugars and are more sensitive to scorching during the Maillard phase. Washed coffees are cleaner and generally more forgiving. For a full breakdown of how processing methods affect flavor, the differences are worth understanding before you build a profile.
Key adjustments roasters make based on these factors:
- Raise or lower charge temperature based on bean density
- Extend or shorten the drying phase based on moisture content
- Reduce peak gas application for natural-processed beans to avoid scorching
- Adjust airflow to manage convective heat and smoke removal
- Shift drop temperature up or down by a few degrees to fine-tune roast level
How to read and develop your own roast profiles
The roast curve is a graph with time on the x-axis and temperature on the y-axis. BT runs as the primary S-shaped line. RoR appears as a secondary line, often on its own scale, and it is the one you watch most closely during the roast.
A healthy RoR line rises early, peaks during drying, then glides steadily downward through Maillard and development. A spike or sudden crash in RoR signals a problem: too much heat applied too fast, or a sharp pullback that stalls development. Roasting software like Cropster, Artisan, and Ikawa logs every roast, overlays profiles for comparison, and links curve data to cupping scores so you can trace flavor back to specific decisions.
| Parameter | What to watch | Typical adjustment |
|---|---|---|
| Charge temp | Sets initial heat; too high scorches, too low stalls | Raise 5–10°C for dense beans |
| Gas (heat) | Drives RoR; reduce gradually after turning point | Cut gas at yellowing to smooth RoR |
| Airflow | Controls convective heat and smoke removal | Open damper at first crack |
| Drop temp | Determines roast level | Adjust by 2–5°C to shift light/medium/dark |
Pro Tip: Change only one variable between batches. Adjusting charge temp, gas, and airflow simultaneously makes it impossible to know which change moved the flavor. One variable at a time, then cup the result.
Tracking environmental conditions matters just as much as the profile itself. Ambient temperature and humidity affect heat transfer efficiency, so the same profile run on a cold January morning and a humid August afternoon will produce different results. Log the room temperature and humidity alongside every roast.
Expert insights on roast profiling that most guides skip
The most common mistake beginners make is reacting too aggressively to RoR fluctuations. Chasing the curve by making constant micro-adjustments creates erratic heat application and inconsistent results. Experienced roasters make fewer, more deliberate moves and let the roast settle between changes.
Scott Rao makes a point that cuts through a lot of online noise: there is no correct roast duration. Eight minutes might be perfectly appropriate on one machine and dangerously fast on another. Optimal roast time depends on the ratio of batch size to burner output, not on any universal rule.
Cupping is the final word. A beautiful curve that produces a flat, hollow cup is a failed profile. A slightly irregular curve that cups brilliantly is a success. Data guides the process; taste validates it.
At Font-mag, this philosophy runs through everything from the Broken Arrow Reserve to the full specialty beverage lineup. If you want to explore beyond coffee while you dial in your roasting, Font-mag’s matcha collection and MAG Tea selections offer the same commitment to sourcing quality that makes a great roast worth chasing.
Roast profile examples for different coffee origins and styles
Different origins call for genuinely different approaches, not just minor tweaks.
Ethiopian naturals are dense, high-grown, and loaded with fruit sugars. They benefit from a moderate charge temperature, a careful Maillard phase to avoid scorching those sugars, and a relatively short development time to preserve the blueberry and jasmine notes the origin is known for. Drop around 205–210°C for a light roast that keeps the fruit intact.
Colombian washed coffees are more forgiving. Medium density and clean flavor make them a good canvas for experimenting with DTR. A medium roast drop around 215–220°C develops the caramel and red fruit notes without pushing into bitterness.
Brazilian naturals are lower-grown, lower-density, and naturally sweet. They take heat well and suit a medium to medium-dark profile. A longer development time brings out chocolate and nut characteristics. Drop around 218–225°C.
Sumatra wet-hulled coffees have irregular moisture content and lower density. They need a slower drying phase and respond well to a longer, lower-heat approach. The earthy, full-bodied character of Sumatra comes through best at a medium-dark roast.
Decaf beans deserve a separate note. The decaffeination process softens the cellular structure, so decaf beans absorb heat faster than their caffeinated counterparts. Lower your charge temperature by 5–10°C and watch the RoR carefully. Font-mag’s retail coffee range includes specialty decaf options for roasters who want a quality green to work with.
How roast profile changes affect consistency and repeatability
Consistency is the practical payoff of understanding roast profiles. Every variable you track and control is a variable that cannot surprise you later.
Small changes compound. A 5°C shift in charge temperature moves the turning point, which shifts the Maillard onset, which changes the RoR trajectory, which alters the drop temperature even if you try to hit the same endpoint. This is why roasters who change one parameter at a time learn faster than those who adjust everything at once.
Environmental factors add another layer of variability. The same profile run on different days yields different results because ambient conditions change heat transfer efficiency. Logging room temperature and humidity alongside every roast turns those variables from surprises into data points you can account for.
Overlaying profiles in software like Artisan or Cropster shows exactly where two roasts diverged. If your curves match through the drying phase but split at Maillard onset, you know the environmental shift happened early. That kind of diagnosis is only possible when you have clean, consistent data from every batch.
Repeatability also depends on green coffee consistency. Even with a perfect profile, a new crop of the same origin can behave differently due to changes in moisture content or density. Cupping every new lot before committing to a profile saves time and prevents a run of disappointing batches.
Key Takeaways
A roast profile is the time-temperature curve that controls every flavor outcome in coffee, from acidity and sweetness to body and bitterness, and mastering it requires tracking Bean Temperature, Rate of Rise, and environmental conditions together.
| Point | Details |
|---|---|
| BT and RoR are the core metrics | A healthy RoR declines smoothly from 10–12°C/min at turning point to 4–6°C/min at drop. |
| Bean characteristics drive profile decisions | Density, moisture, and processing method all change how heat moves through the bean. |
| DTR is a tool, not a rule | Development Time Ratio indicates roast balance but depends entirely on equipment and roast style. |
| Change one variable at a time | Adjusting multiple parameters between batches makes it impossible to trace flavor shifts to a cause. |
| Cupping validates the curve | A technically clean profile that cups poorly is a failed roast; sensory evaluation is the final judge. |
Recommended
- Coffee Roast Levels Explained: A Flavor Guide for Enthusiasts – Font Coffee Roasters
- The Role of Bean Density in Roasting: a Home Roaster’s Guide – Font Coffee Roasters
- Texas Roast Coffee Brewing Guide for Enthusiasts – Font Coffee Roasters
- Supporting Local Roasters Checklist for Coffee Lovers – Font Coffee Roasters